| Dyno Results | |
| Vital Statistics | |
|
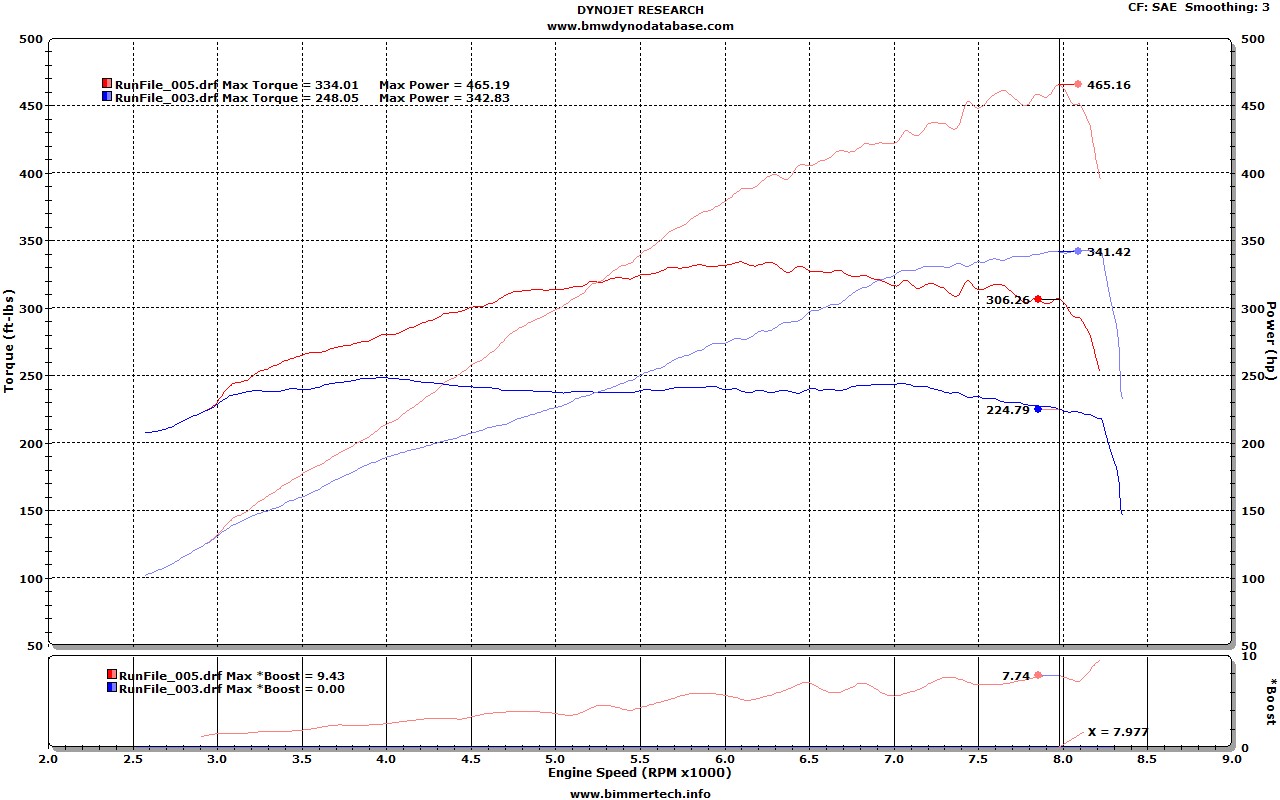
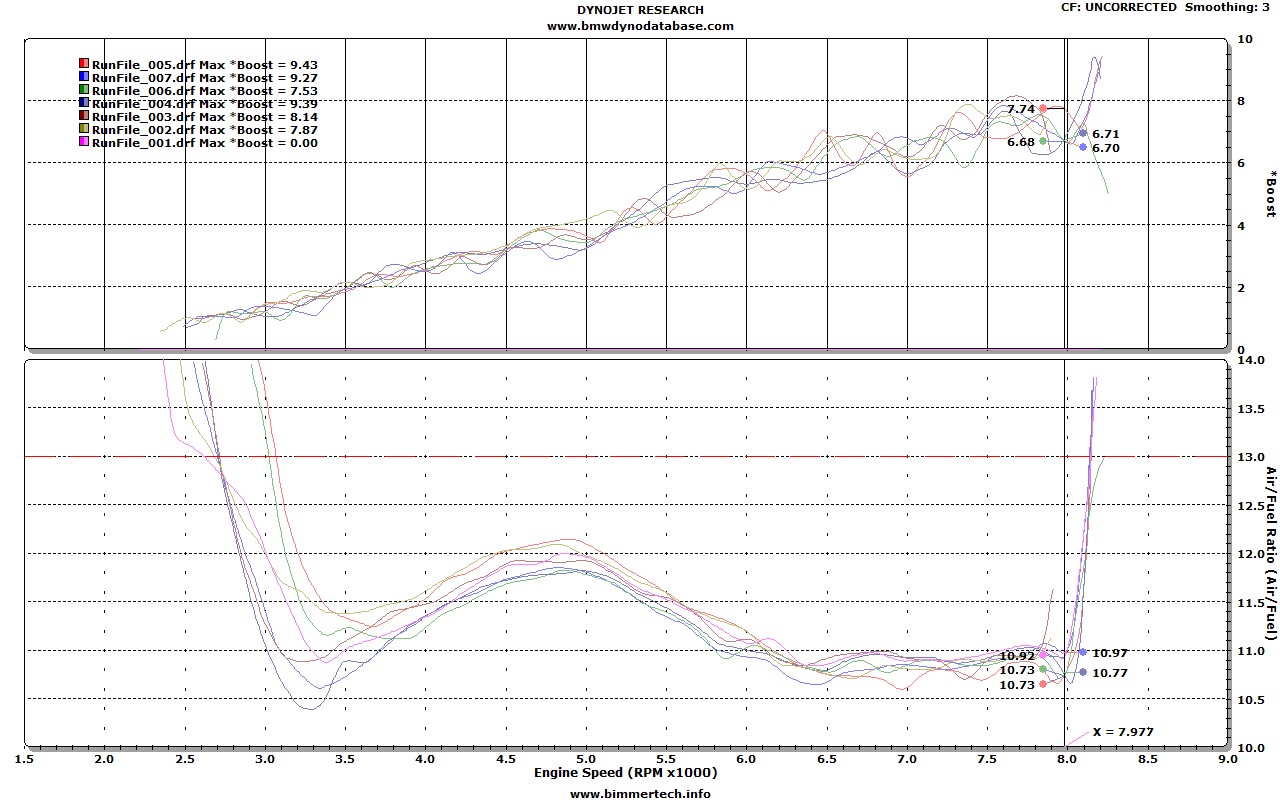
BMW E9x M3 (S65 Motor) Dynojet SAE (J1349) Download-1 Boost pressure (7.70 PSI) verified with boost log. |
| Configuration / Modifications: | |
|
| Measured Results: | ||||
|
334 FT/LBS 465 HP |
@ 6250 RPM @ 8000 RPM |
(452.8 NM) (471.4 PS) |
(46.18 KGM) (346.8 KW) |
| Dyno Graphs: |
 |
| The baseline dyno chart is not from this same vehicle. The baseline was taken from a 2011 BMW M3 ZCP with DCT. This baseline was taken on the same dyno under near-identical weather and density-altitude conditions. The DCT typically shows +15whp difference over the 6MT on the same dyno. Subtract 15whp from the baseline for a good approximation of what a 6MT would have as a baseline on this same dyno. |
| Alternate Images: |
| All Dyno Runs |
 |
| All Dyno Runs |
 |
| Videos: |
| Other images: |
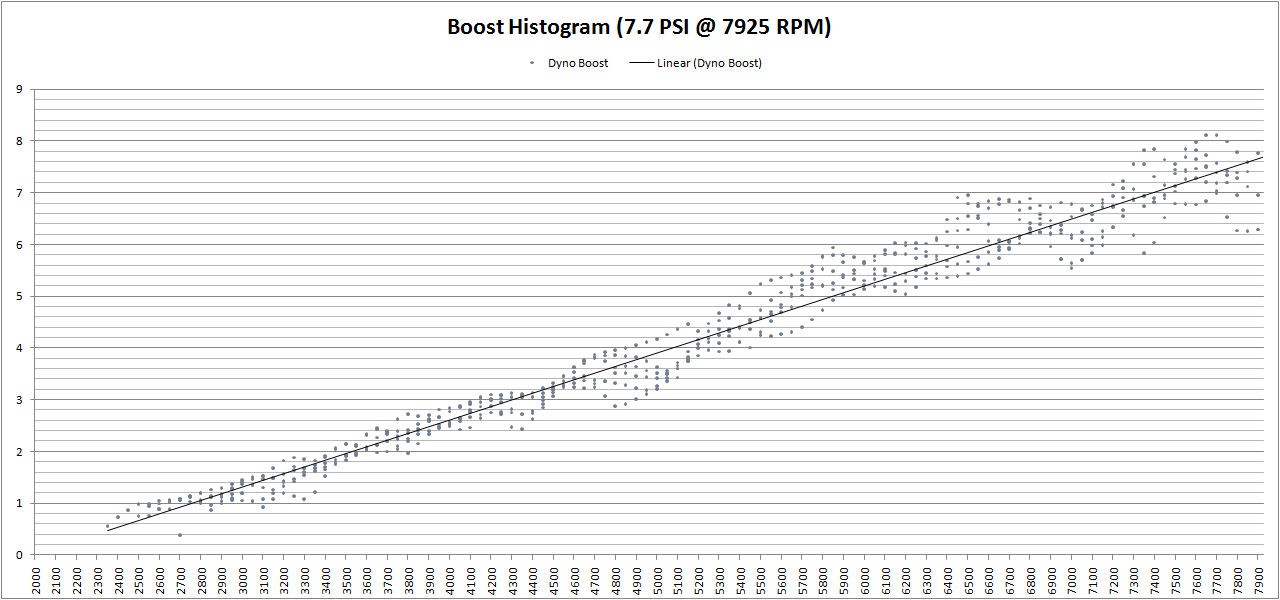
| Boost Log Analysis: 7.70 PSI Average, 9.43 PSI Peak |
 |
| Car and Modifications:
Conditions:
Results:
Dyno Database:
Dyno Testing Procedures: These procedures were specified by Active Autowerke. Since we were on 91 octane, methanol injection must be used. We originally intended to conduct tests with and without methanol injection, but were advised not to do so without 93 octane gasoline. We were instructed to run the dyno and let the car cool down one minute between runs. At the end of three runs, we were instructed to turn off the motor, let the engine cool for ten minutes, then repeat the same testing procedure for three more runs. In addition to capturing horsepower, torque, and engine RPM, we originally intended to collect spark advance, and knock sensor data from the OBD port via the Bavarian Technic scan tool (with thanks to Bren @ Bren Tuning for providing the necessary configuration file). However, once we hooked up the BT tool to the OBD port, we discovered we could not read any data from the OBD port using the BT tool. We did not try to diagnose the problem since we were "on the clock" at the dyno shop. We later found out this was caused by the Akrapovic Delete-R installed in the system. We were therefore unable to capture any spark or knock sensor data. If time permits, we plan to return to the dyno with the same configuration, remove the Delete-R and re-test. All of the dyno runs are filmed in HiDef video to document the authenticity and independence of the tests. A Kestral 4500 portable weather station is brought to take independent weather measurements. This provides a cross-check for the dyno weather station to ensure that the dyno weather station is reading accurately and has not been tampered or altered in any way. Individual Dyno Results: Individual dyno results are shown below. SAE corrected results are shown twice, using two different sources. The first source (djc) are the SAE corrected results straight from the Dynojet. The second source (sae) of SAE corrected results are obtained by using the Kestral 4500 weather station data for each individual dyno run and running it through an independent SAE correction formula. This ensures that the dyno results are accurate and can be independently audited and verified for authenticity and accuracy. The legend below has the following meaning:
* Entry used for the Dyno Database Methods for calculating average boost:
Notes about Dyno Boost Log: The boost in this entry looks a little irregular; it seems to waver quite a bit. As more results are provided from this dyno, the boost data will regularly be monitored for accuracy. If the results are found to be inaccurate, then the entry in the Dyno Database will be adjusted accordingly -- up or down -- depending on the results of newer analysis. Notes about Baseline Vehicle: The baseline dyno chart is not from this same vehicle. The baseline was taken from a 2011 BMW M3 ZCP with DCT. This baseline was taken on the same dyno under near-identical weather and density-altitude conditions. The DCT typically shows +15whp difference over the 6MT on the same dyno. Subtract 15whp from the baseline for a good approximation of what a 6MT would have as a baseline on this same dyno. |